
- ChangeGPS Knowledge Base and Support Articles
- TaxPlan
- Getting started with your first TaxPlan
What are the amounts used in the comparison graph in the TaxPlan report
All values are derived from the recommended scenario for example:
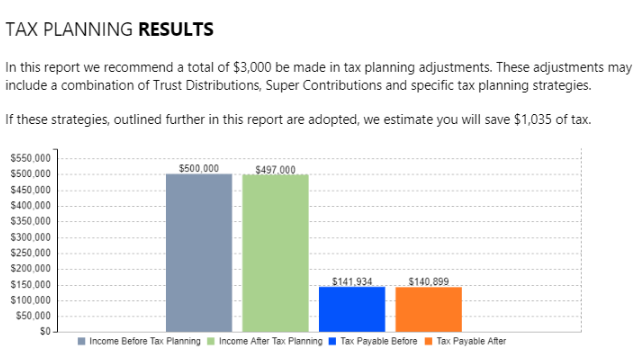
Income Before and Income After Tax Planning
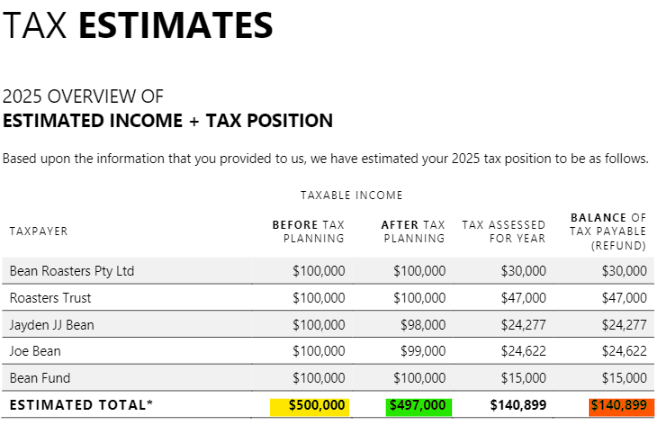
Taxable income for the client group total as follows (Yellow and Green)
Tax Payable After
Total of Balance of Tax Payable as per group total in Tax Estimates summary table (Orange)
Tax Payable Before
Calculated as Estimated Tax Payable / Refundable Total + Tax Savings from Tax Planning Strategies Total
